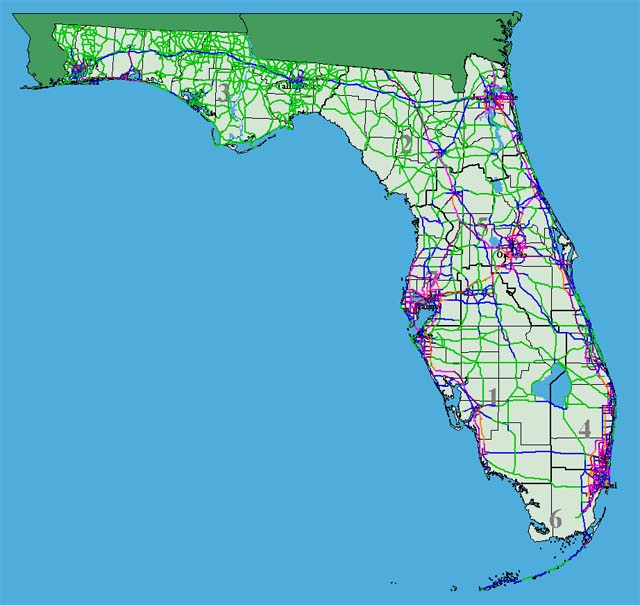
 Several years ago I discovered that Florida’s Department of Transportation was making highway and traffic studies available on DVD for free. I gave them a call and talked with a guy who seemed really pleased that anyone was interested in their work, particularly to find good places to cycle.
Every June since then, like clockwork, a new and improved set of DVDs arrives. I usually spend a couple of hours poking around and still never discover all the cool things that are on them.
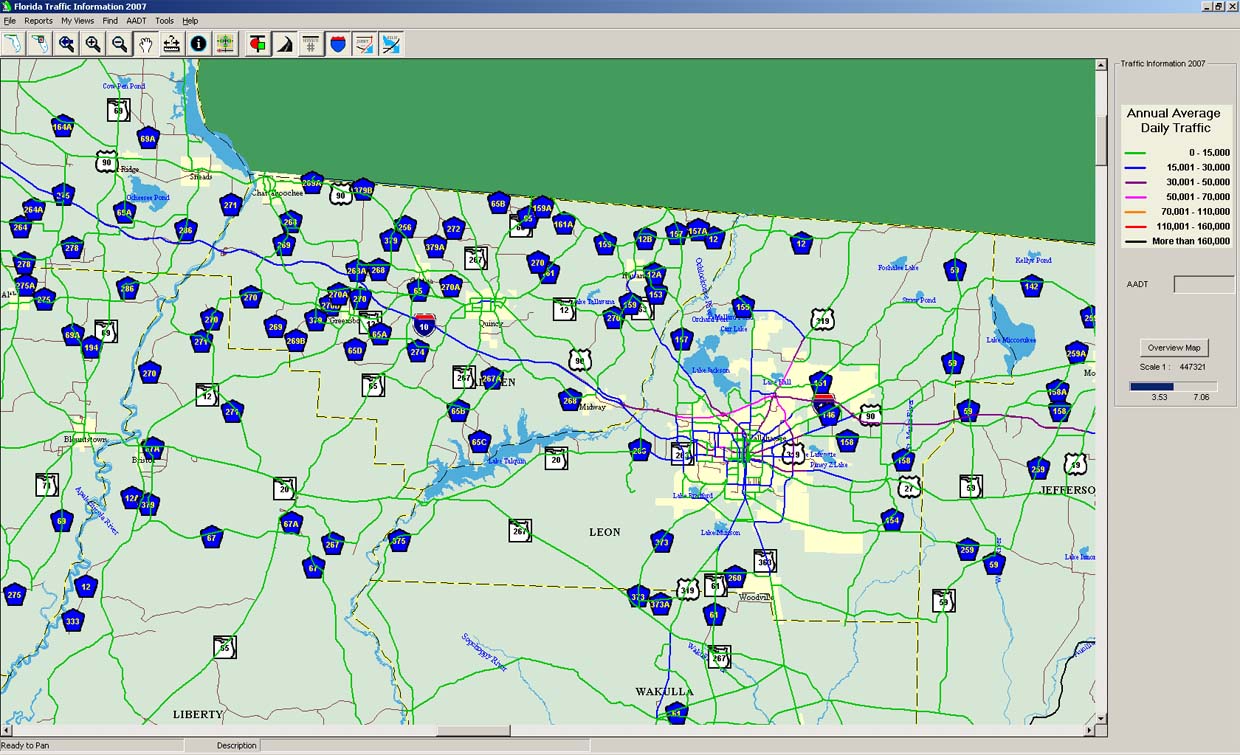
Green means low traffic
This screen shot is an example. The green roads in the map at right have an annual average traffic count of less than 15,000 vehicles per day.
Now, low traffic counts don’t always mean that the road is suitable for safe cycling, but it’s not a bad indicator.
You can turn on more or less detail, depending on how closely you’ve zoomed into an area and how cluttered it gets.
The map at left is showing the Tallahassee area where the 2008 TOSRV was held. I turned on place names, road markers and river and lake names.
Ever pass those black hoses stretched across the road and wonder what they were?
They were temporary traffic counters. Turn to the FDOT DVD and it’ll tell you how many vehicles were headed in which direction. You can reports that slice and dice traffic data to give you hourly traffic flow by month, road and direction. Everytime you click on a new place you find some gee-whiz factoid.
How many miles of roads does Briny Breezes have?
Ever wondered how many miles of paved roads Briny Breezes has? The answer is 1.00. Lake Worth, FL, has 102.45 miles of paved roads and 17.03 that are unpaved. Try working that into a casual conversation sometime. Port St. Lucie has 876.80 miles of paved roads, but West Palm Beach only has 253.70.
Filling out an expense report and need to know how far it is between Point A and Point B? It’s there. Want to know, to three decimal places the exact milepost of an exit? Or the cumulative distance between exits? Yep.
Check out the website and take advantage of your Florida tax dollars at work. By the way, some of the traffic studies go back to 1993. It’ll be interesting to check the 2009 and 2010 stats to see what higher gas prices will do.


Very cool. I have some very similar local maps produced by the Polk County Transportation Authority, but this will come in handy for planning longer rides. Already ordered one :)
Todd,
I’ve been putting off a new DOT mapping story. They also have something similar to Google’s Street View that shows pictures taken along a lot of Florida’s highways.
It’s amazing what our tax money pays for that most folks don’t know exists. Some great resources out there.
If you make some calls, the geeks in DOT love to talk about their work.